When Do Ticket Prices Drop? What the Trends Actually Show


Ticket price trends show a clear pattern: prices generally sit at a preset floor for weeks, drift with demand, and either soften a few days before doorstop for cold events or spike hard in the final 72 hours for hot ones. Your job is to figure out which type of event you are watching, then act accordingly. A tracked price chart shows you three things that matter: the current floor, how it’s moved over the last week, and how many listings are sitting below your target. If the floor has been flat for 10 days and listings are piling up, you can usually wait. If the floor just jumped and listings are thinning, buy.
Here’s what to do in the next 10 minutes:
Set a price alert on your target event with a specific dollar ceiling, not a vague “let me know if it drops.”
Pick a target price based on the current 7-day low, not the sticker price you first saw.
Check weekday listings versus weekend listings. Weeknight tickets and weekday check-ins are frequently cheaper.
Key Takeaways
Ticket price trends reward buyers who track liquidity and floor price together, not price alone, and who match their timing strategy to the specific event type.
Point | Details |
Most tickets start fixed | A large majority of tickets are initially sold at preset prices, so early listings tend to be more stable than later resale activity. |
Watch liquidity, not just price | A rising floor with thinning listings signals scarcity; buy soon instead of waiting for a drop. |
Weekday timing helps | Weeknight listings often undercut weekend dates for the same tour or event. |
Demand is splitting by income | A K-shaped pattern means top-tier stadium prices keep climbing even as budget-tier sales grow. |
Use The Ticket Blog for context | The Ticket Blog pairs price guides and promo codes with marketplace comparisons to help you time and place your purchase. |
Table of Contents
What Are Ticket Price Trends and Why Do They Matter?
A ticket price trend is simply the record of what a seat category actually sold or listed for over time, tracked as a floor price, a median, and a volatility range. It’s not the face value printed on the original ticket. It’s the moving target created by resale activity, dynamic pricing adjustments, and shifting demand as the event date approaches.
Most events start with the majority of inventory priced and released as fixed prices, not algorithmically adjusted in real time. Research on event pricing found that a large majority of tickets are initially sold at preset prices, with only a smaller share adjusted dynamically afterward, which is why researchers argue venues should treat pricing as a portfolio problem across seating sections rather than optimizing each section in isolation, according to University of Miami researchers. That matters for you because it means early listings are often more stable than people assume, and the real volatility shows up later, driven by resale supply and event-specific demand shocks.
Zoom out further and the picture gets less forgiving. Concert and live-entertainment admission prices have climbed faster than the Consumer Price Index across the last three decades, so “wait for prices to return to normal” is rarely a sound long-term strategy. Waiting for the right week within an event’s own cycle works, but waiting for the market to reset does not.
How Does Ticket-Price Tracking Actually Work?
Tracking tools pull data from a mix of public listing pages, marketplace snapshots, and in some cases direct API feeds, then log a “price floor” (the cheapest available ticket at that moment) and a most-booked-seat estimate at set intervals. Some tools crawl hourly, others aggregate daily, and a few use live websocket feeds for near-real-time updates. The sampling frequency directly shapes what you see: hourly snapshots make normal listing churn look more volatile than it is, while daily aggregates smooth that noise but can miss short-lived drops.
Before trusting any chart, check for three things:
A visible list of data sources, so you know whether it’s pulling from Ticketmaster, StubHub, SeatGeek, or all three.
An update frequency label or “last updated” timestamp on the chart itself.
Enough historical snapshots to actually show a trend, not just a single data point dressed up as a chart.
Pro Tip: Newly listed events often show a flat, suspiciously smooth line for the first week or two because there simply aren’t enough snapshots yet. Don’t read early flatness as price stability. Wait for at least five to seven data points before trusting the trend.
Where Can You Track Ticket Prices in Real Time?
Three categories of tools cover most of what buyers actually need, and each fits a different kind of shopper. TicketData functions as a historical-depth tool, logging price movement over weeks or months so you can see where an event’s current floor sits relative to its own past. Event Spy leans toward real-time alerting, watching listings continuously and pinging you the moment a price crosses a threshold you set. TixTrend, a developer-oriented tool distributed through GitHub, gives technically inclined buyers raw access to price-history data they can filter, chart, or feed into their own scripts.
Beyond those three, browser extensions layer price context directly onto marketplace pages while you shop, and resale marketplaces themselves (StubHub, SeatGeek, Vivid Seats) increasingly show basic price-history graphs inline.
Best for | Coverage | Cost model | Refresh frequency | Extra features |
Historical depth | Concerts, sports, theater | Free / freemium | Daily aggregates | Downloadable charts |
Real-time alerts | Concerts, sports | Freemium, paid tiers | Hourly or live | Push/email alerts |
Developer access | Concerts, sports (varies by feed) | Free, open-source | Depends on crawl schedule | Raw data export, custom filters |
If you’re a casual fan who checks in twice before a show, a real-time alert tool saves you the most effort. If you’re price-sensitive and want to see the full arc before committing, historical-depth tools give you better context. Researchers and resellers who want to build their own models lean toward developer feeds like TixTrend. Whichever you pick, credibility comes down to the same checklist from the section above: named data sources, a visible refresh cadence, and a methodology page that explains what’s actually being measured.
What Do the Numbers on a Price Chart Actually Mean?
Five numbers matter more than the rest of the chart combined: the get-in price (cheapest listing available), the median price (what a typical buyer actually pays), the 7-day low, the percent change over the last week, and liquidity (how many listings exist at or near your target price band).
A sharp price drop with rising liquidity usually signals a seller flooding the market, often a good buying window. A sharp spike with thinning liquidity usually means demand is outrunning supply, and waiting tends to cost you more. A flat line for over a week with steady listings typically means the market has settled into equilibrium, so timing matters less.
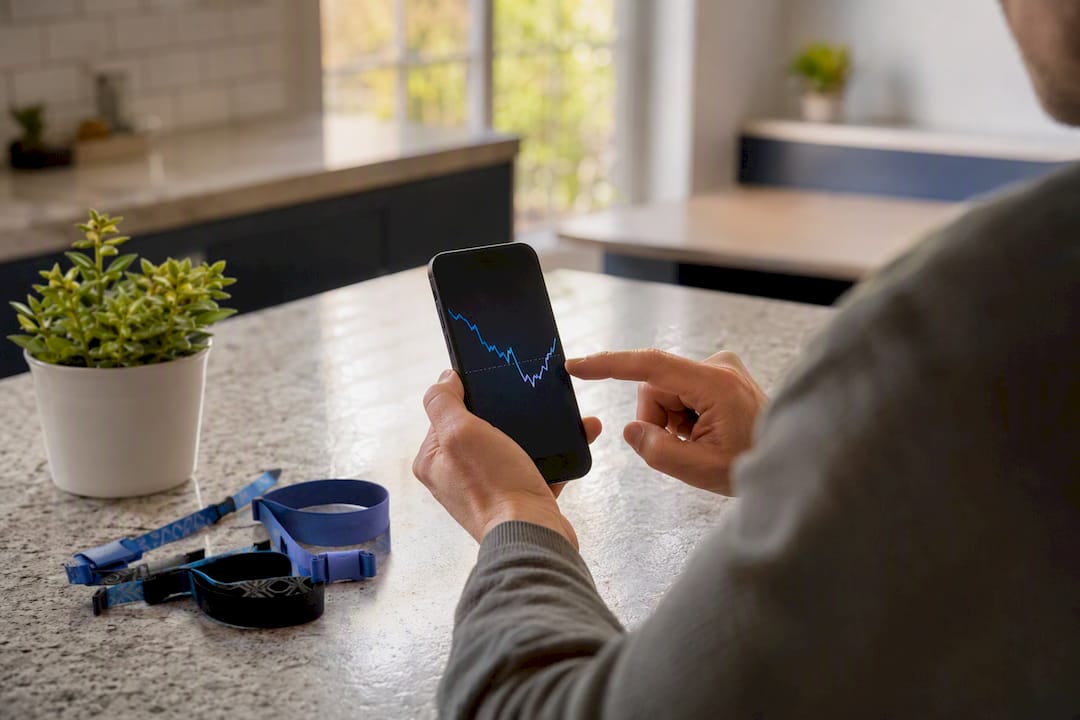
Run this three-step check before buying: compare the current floor to the 7-day low, check the median against your budget, then scan how many listings sit below your target price.
Pro Tip: Overlay weekday patterns on the chart if the tool allows it. Snapshot data from The Stage Tracker found weeknight concert listings consistently undercutting weekend dates for the same tour, so a Tuesday show can carry a noticeably lower price floor than a Saturday one.
When Is the Best Time to Buy Tickets?
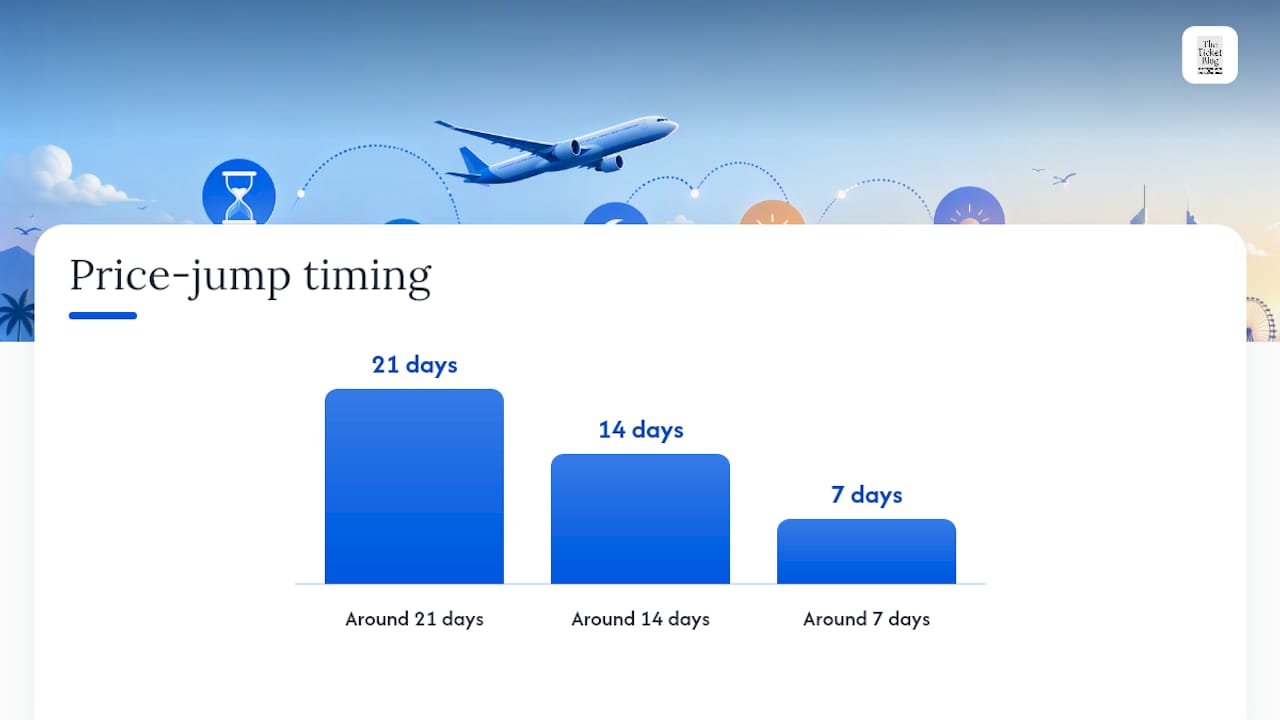
Timing depends heavily on how much natural scarcity the event has, and airline pricing research offers a useful, if imperfect, parallel: UC Berkeley Haas researchers found meaningful price jumps around 21, 14, and 7 days before departure as inventory tightens, a pattern that echoes in high-demand concerts and playoff sports tickets even though venues don’t use the exact same fare-bucket system airlines do.
Apply this checklist to your specific event:
Check liquidity: dozens of active listings usually means you can afford to wait; a handful means act now.
Count days to event: under 10 days with thin inventory favors buying immediately.
Read the recent trend: a rising floor over the last week is a signal, not noise.
Watch for external triggers: a lineup change, a playoff win, or a new tour date announcement can flip the trend overnight.
For big stadium tours, prices often trend upward as the date nears, especially after strong regional sales. Mid-tier arena shows tend to soften if they aren’t selling out, sometimes dropping in the final week. Secondary-market theater tickets frequently see last-minute discounting when producers try to fill remaining seats, a pattern worth tracking through the final days before curtain.
What Actually Drives Ticket Price Movement?
Demand-side pressure comes from artist or team popularity, income segmentation among fans, seasonality, and whatever else is competing for the same weekend. Supply-side pressure comes from venue capacity, how seat tiers are split, and how many seats get held back for private allotments before public sale, a factor covered in more depth in The Ticket Blog’s guide to private sales.
Market mechanics matter just as much. Dynamic pricing adjustments, resale listing volume, and checkout fees (which typically layer 22 to 30% onto a listed floor) all shift what you actually pay versus what the chart shows. External shocks compound everything: a rerouted tour, severe weather near an outdoor venue, or a broader economic pullback can shift a trend line within days. Airline pricing research offers a useful reminder here too. Seasonality, route competition, and booking lead time all move fares in similar ways, a taxonomy that maps reasonably well onto event tickets.
What Does Research Say About Where Ticket Prices Are Heading?
The data points to a widening gap rather than a leveling off. Industry reporting describes a K-shaped demand pattern: higher-income fans keep paying premium prices for top-tier stadium shows, while price-sensitive buyers increasingly skip expensive tours altogether. The average ticket for a top 100 global tour hit about $136 in 2024, roughly 50% above 2019 levels, even as a large share of platform sales stayed under $100.
University of Miami researchers argue this creates a real tension for venues and artists: aggressive dynamic pricing captures more revenue in the short term, but risks alienating the fans who build long-term loyalty. As analytics get more sophisticated, expect more personalized pricing experiments, and more scrutiny over whether that personalization is fair or exploitative.
When you read a pricing study or industry report, check three things before trusting its numbers: who ran it, how large the sample was, and whether it used actual marketplace snapshots rather than survey estimates or projections.
How Do You Set Up Price Alerts the Right Way?
Choose your coverage level: a single event tracker for a one-off show, or a broader dashboard if you’re watching several events at once.
Set a target price and an acceptable section range, not just a single seat number.
Decide your alert frequency: instant push notifications for hot events, daily digest emails for ones you’re casually watching.
Set a backstop rule: either auto-notify only, or (where the tool supports it) an auto-buy trigger once your price hits.
Layer in filters for day-of-week, specific seat zone, seller type (primary box office versus resale), and listing age, since older listings sometimes carry more negotiating room. A strict budget buyer should set a hard ceiling and a wide date window. A flexible fan can loosen the price target but tighten the date range. A last-minute buyer should watch liquidity more than price, since availability disappears faster than price drops.
Pro Tip: Test your alert setup on a low-stakes event first, something you don’t actually plan to buy, so you can see how often it fires and adjust the sensitivity before relying on it for a show you actually want.
Reading the Data Without Losing the Plot
Price charts are useful right up until you start treating them as certainty. The single biggest mistake we see buyers make is chasing the absolute lowest historical price instead of matching their target price to what the current chart is realistically showing. A patient, data-led approach beats gut instinct almost every time, but patience has a ceiling. If liquidity is thinning and the trend is climbing, waiting for a better number that already came and went isn’t strategy. It’s wishful thinking. Match your priorities (which seats matter, what you’re willing to spend) to the trend in front of you, not the one you wish existed. For more on how specific venue fees factor into your real checkout total, see The Ticket Blog’s fee breakdown.
Get Curated Price Alerts and Deal Guides From The Ticket Blog
Chasing scattered tracker data across five different apps wastes time you could spend actually deciding when to buy. The Ticket Blog pairs plain-language pricing guides with curated deal roundups and promo codes, so you get the buying context most standalone trackers skip. Instead of just showing you a chart, our guides on marketplace comparisons and primary versus secondary sites tell you where a given event’s best deal is actually likely to show up. Start by browsing The Ticket Blog for current promo codes and pricing guides tied to the shows and games you’re already watching.
Frequently Asked Questions About Ticket Price Trends
Will ticket prices go down if I wait? It depends on liquidity and demand. If listings are piling up and the floor has been flat or falling, waiting often pays off. If liquidity is thinning and the trend is climbing, waiting usually costs more.
What is a “get-in price” on a ticket chart? It’s the cheapest available listing at that moment, also called the price floor. It’s not the average price a typical buyer pays, which is closer to the median.
Do checkout fees show up in tracked price history? Usually not. Listed floors typically exclude service and delivery fees, which commonly add 22 to 30% at checkout, so budget beyond the number you see on a chart.
Are sports tickets and concert tickets affected by the same trends? Not identically. Sports tickets react sharply to playoff advancement and team performance, while concert tickets respond more to artist popularity, tour scale, and venue tier.
How often should I check a ticket-price tracker? For hot events within two weeks of the date, check daily or set real-time alerts. For events further out with plenty of available seats, weekly check-ins are usually enough.
Sources
Researchers explore the complex science of event ticket pricing | University of Miami
Research shows how airline pricing really works - Haas News | UC Berkeley Haas
Concert ticket prices are reshaping summer live music demand | CNBC
Concert Ticket Prices vs. Walt Disney World vs. Inflation | Britannica Money
Recommended


Comments